El rastreo clonal con epimutaciones somáticas revela la dinámica del envejecimiento sanguíneo -Nature-
“Códigos de barras” escritos en nuestro ADN revelan cómo envejece la sangre
- Un equipo del CRG y el IRB Barcelona identifica patrones de metilación naturales que desvelan cambios en la sangre detectables a partir de los 50 años y casi universales a los 60.
- Este hallazgo allana el camino para detectar signos tempranos de enfermedades relacionadas con el envejecimiento mucho antes de que aparezcan los síntomas, y mbién facilita la posibilidad de explorar nuevas terapias para retrasar el envejecimiento en humanos.
- El trabajo, publicado en la revista Nature
ha contado con la financiación de la Asociación Española Contra el
Cáncer, CRIS contra el cáncer y la Asociación Europea de Hematología,
entre otros.
A medida que envejecemos, el sistema sanguíneo se deteriora: la competencia entre las células madre que lo componen se desequilibra, alterando la producción de células sanguíneas y aumentando la vulnerabilidad a enfermedades.
Un nuevo estudio publicado hoy en la revista Nature por investigadores del Instituto de Investigación Biomédica (IRB Barcelona) y el Centro de Regulación Genómica (CRG) explica cómo la edad remodela el sistema sanguíneo. Tanto en humanos como en ratones, unas pocas células madre superan a sus vecinas y gradualmente toman el control de la producción de sangre. Este proceso conduce a la reducción de la diversidad de células madre sanguíneas y al predominio de aquellas que muestran preferencia por la producción de células mieloides, que son células inmunes vinculadas a la inflamación crónica.
Estos cambios ya son detectables a partir los 50 años y son casi universales a partir de los 60. Los autores del estudio sugieren que la pérdida de diversidad de clones podría ayudar a explicar el "inflammaging", la inflamación crónica persistente que surge durante el envejecimiento y que puede hacernos más vulnerables a distintas enfermedades. El equipo observó este patrón tanto en ratones como en humanos, lo que sugiere que los hallazgos son una característica fundamental del envejecimiento de la sangre en todas las especies.
El hallazgo puede impulsar nuevas estrategias para detectar signos tempranos de envejecimiento no saludable mucho antes de que aparezcan los síntomas, ayudando así a prevenir enfermedades como la leucemia mieloide, la enfermedad cardiovascular, o los trastornos inmunitarios. También abre la puerta a estudiar la viabilidad de terapias que retrasen el envejecimiento en humanos, un ámbito que tradicionalmente se ha centrado en modelos animales.
“Nuestras células madre sanguíneas compiten por sobrevivir. En la juventud, esa competencia genera un ecosistema rico y diverso pero, en la vejez, algunas desaparecen por completo. Unas pocas células madre toman el relevo y trabajan el doble para compensar, lo que reduce la diversidad y debilita la resiliencia del sistema sanguíneo. Las células madre diversas pueden responder a diferentes tensiones, por lo que el predominio de un puñado de clones hace que todo el sistema sea más frágil”, explica el Dr. Lars Velten, jefe de grupo en el Centro de Regulación Genómica (CRG) en Barcelona que ha co-liderado del estudio.
Epimutaciones: los códigos de barras naturales del ADN
En los jóvenes, hay entre 50.000 y 200.000 células madre sanguíneas activas que producen de 100 a 200 mil millones de células nuevas cada día. Rastrear cada célula sanguínea hasta su célula madre original hasta ahora ha sido solo posible en modelos animales para los que hay que modificar genéticamente el ADN, algo inviable y poco ético en humanos.
El equipo recurrió a las epimutaciones: cambios en las marcas químicas (metilaciones) que se adhieren al ADN y le indican a la célula qué genes activar o silenciar. Cuando una célula madre se divide, estas marcas se copian en las células hijas, dejando un “código de barras” permanente que los investigadores pueden leer para reconstruir el árbol genealógico celular.
Nuestras células portan cambios genéticos que colectivamente nos hacen individuos únicos. Pero dentro de cada individuo, llevamos también un mosaico de alteraciones genéticas y epigenéticas. Estas alteraciones se heredan dentro de cada familia de células que, aunque acaben realizando diferentes funciones, comparten las marcas que las vinculan a una célula madre ancestral común. Por fin hemos podido construir el árbol genealógico epigenético leyendo la información escrita directamente en el ADN de cada célula”, comenta el Dr. Alejo Rodríguez-Fraticelli, investigador ICREA del IRB Barcelona y co-autor correspondiente del estudio.
EPI-Clone: reconstruyendo la historia de la sangre célula a célula
Para hacer frente a este reto, los investigadores han desarrollado una técnica llamada EPI-Clone, que lee estos códigos de barras de metilación en cada célula basándose en la plataforma Tapestri de Mission Bio para secuenciación de células individuales. Con ella reconstruyeron la historia de la producción sanguínea en ratones y humanos, identificando qué células madre contribuyen a la sangre y cuáles van abandonando la carrera a lo largo del tiempo.
“La metilación del ADN funciona como un código binario: cada sitio del genoma está metilado o no, como un 1 o un 0”, explica el Dr. Michael Scherer, bioinformático y co-primer autor del trabajo en el CRG, ahora jefe de grupo en el Centro Alemán de Investigación del Cáncer (DKFZ). "Esta sencilla información de encendido y apagado puede transformarse en un código de barras natural, uno que cada célula madre transmite a sus descendientes. Hace cinco años, no habría creído esto posible con una resolución unicelular, en decenas de miles de células. Ha sido un gran salto adelante en la tecnología", añade.
Cambios en la diversidad de las células madre
En la sangre joven, miles de células madre diferentes contribuyen a un conjunto rico y diverso de glóbulos rojos, glóbulos blancos y plaquetas. Sin embargo, EPI-Clone reveló que en ratones de edad avanzada, hasta el 70% de las células madre sanguíneas pertenecían a sólo unas pocas docenas de grandes clones.
La situación es similar en los humanos, aunque el porcentaje exacto variaba entre la docena de donantes sanos de entre 35 y 70 años que participaron en el estudio. El estudio reveló que, a partir de los 50 años, muchas células madre sanguíneas empiezan a desaparecer y los clones más grandes empiezan a tomar el control. A partir de los 60 años, el cambio se hace aún más pronunciado.
“El paso de la diversidad al predominio de unos pocos no es aleatorio, sino que sigue el ritmo como un reloj”, señala el Dr. Indranil Singh, co-primer autor e investigador del IRB Barcelona, ahora en el Broad Institute de Harvard y MIT. "A los 50 años, ya se puede ver que empieza, y después de los 60, parece casi inevitable”.
Implicaciones clínicas y terapias de rejuvenecimiento
El estudio también descubrió que algunos clones grandes albergaban mutaciones relacionadas con la hematopoyesis clonal, un proceso en el que algunas células madre sanguíneas adquieren mutaciones que les permiten crecer y multiplicarse más rápido que otras. El fenómeno se vuelve más común con la edad y se ha demostrado que aumenta el riesgo de enfermedades cardíacas, accidentes cerebrovasculares y leucemia. Sin embargo, muchos de los clones dominantes identificados por EPI-Clone no tenían ninguna mutación conocida, lo que sugiere que la expansión clonal es una característica general del envejecimiento de la sangre, no sólo un signo de riesgo de cáncer.
Esto significa que, en el futuro, los médicos podrían algún día evaluar el comportamiento clonal en sí mismo para la detección temprana, ofreciendo a los médicos una forma de controlar cómo está envejeciendo el conjunto de células madre sanguíneas de una persona años antes de que se desarrolle cualquier enfermedad. Las personas con una pérdida más rápida de diversidad o una rápida expansión de clones de riesgo podrían ser señaladas para recibir atención preventiva.
El estudio también reveló que, tanto en humanos como en ratones de edad avanzada, muchos de los clones dominantes muestran preferencia por la producción de células mieloides. Estas son células inmunes relacionadas con la inflamación crónica. Estudios anteriores en ratones han demostrado que la eliminación selectiva de las células madre con sesgos mieloides puede aumentar la producción de linfocitos que combaten las infecciones y mejorar las respuestas inmunitarias.
Sin embargo, para estudiar las terapias de anti-envejecimiento en humanos, los investigadores primero tendrían que identificar qué clones son problemáticos, algo que no ha sido posible hasta ahora. EPI-Clone es adecuado para la investigación clínica porque funciona con códigos de barras naturales en lugar de etiquetas artificiales que requieren modificación genética. "Si queremos pasar de los tratamientos genéricos anti-envejecimiento a la verdadera medicina de precisión para el envejecimiento, esta es exactamente la herramienta que necesitamos", afirma el Dr. Velten. "No podemos arreglar lo que no podemos ver y, por primera vez, EPI-Clone puede facilitar esto para los humanos". anti
"Sólo hemos demostrado lo que es posible", concluye el Dr. Rodriguez-Fraticelli. "Ahora el objetivo es perfeccionar EPI-Clone para que pueda impulsar los esfuerzos de la investigación clínica".
El estudio ha sido liderado por equipos del Centro de Regulación Genómica (CRG) y el Instituto de investigación Biomédica (IRB Barcelona). Ha recibido financiación de la Asociación Española Contra el Cáncer, CRIS contra el cancer, el European Research Council (ERC), la Asociación Europea de Hematología, la Fundación “la Caixa”, el Ministerio Español de Ciencia y Tecnología, y la Generalitat de Catalunya, a través de CERCA.
Artículo de referencia:
Clonal tracing with somatic epimutations reveals dynamics of blood ageing
Michael
Scherer*, Indranil Singh*, Martina Maria Braun*, Chelsea Szu-Tu*, Pedro
Sanchez Sanchez, Dominik Lindenhofer, Nils Asger Jakobsen, Verena
Körber, Michael Kardorff, Lena Nitsch, Pauline Kautz, Julia Rühle,
Agostina Bianchi, Luca Cozzuto, Robert Frömel, Sergi Beneyto-Calabuig,
Caleb Lareau, Ansuman Satpathy, Renée Beekman, Lars M. Steinmetz, Simon
Raffel, Leif S. Ludwig, Paresh Vyas, Alejo Rodriguez-Fraticelli@, Lars
Velten@
Nature (2025) DOI: 10.1038/s41586-025-09041-8
IRB Barcelona
El Instituto de Investigación Biomédica (IRB Barcelona) trabaja para conseguir una vida libre de enfermedades. Desarrolla una investigación multidisciplinar de excelencia para curar el cáncer y otras enfermedades vinculadas al envejecimiento. Establece colaboraciones con la industria farmacéutica y los principales hospitales para hacer llegar los resultados de la investigación a la sociedad, a través de la transferencia de tecnología, y realiza diferentes iniciativas de divulgación científica para mantener un diálogo abierto con la ciudadanía. El IRB Barcelona es un centro internacional que acoge alrededor de 400 científicos de más de 30 nacionalidades. Reconocido como Centro de Excelencia Severo Ochoa desde 2011, es un centro CERCA y miembro del Barcelona Institute of Science and Technology (BIST).
https://www.irbbarcelona.org/es/news/cientificas/codigos-de-barras-escritos-en-nuestro-adn-revelan-como-envejece-la-sangre
Clonal tracing with somatic epimutations reveals dynamics of blood ageing
Nature (2025)
Main
Lineage tracing using genetic or physical labels has been an important tool in developmental and stem cell biology for more than a century1,2. More recently, genetic barcoding compatible with single-cell RNA sequencing (scRNA-seq) has provided information on the cellular output of hundreds of stem cell clones together with cell-state information on the stem cell itself8,9,10,11,12. Such methods require complex genetic engineering and therefore have limited applications, for example, in humans or during native ageing. Thus, methods are needed that rely on endogenous clonal markers (for example, somatic mutations) and allow tracing of various stem cell clones in parallel. Whole-genome sequencing can reconstruct cellular phylogenies3 but has limited throughput. It also lacks information about cell states, which precludes clonal tracking across cellular differentiation landscapes. Conversely, spontaneous mitochondrial DNA (mtDNA) mutations can be captured together with cell-state information by scRNA-seq or ATAC–seq4,13,14. Although mtDNA variants can be clonally informative, it is unclear whether mtDNA variants can reconstruct cellular phylogenies15,16.
Clonal signals have been identified in bulk DNA methylation data obtained from cancer and healthy tissues17,18. Somatic epimutations, defined as spontaneous but heritable losses and gains of DNA methylation, have been explored as a potential clonal label in cancer19,20. However, differentiation-associated changes in DNA methylation may mask clone-associated differences21,22. Furthermore, current single-cell DNA methylation methods23,24 suffer from data sparsity, which makes it challenging to exploit the stochasticity of epimutations at individual CpGs.
A compelling case for the use of lineage tracing is haematopoiesis, whereby, in humans, 50,000–200,000 stem cell clones generate blood throughout life3. Ageing induces clonal expansion with substantial loss of clonal diversity. In mice, much of our understanding of clonal behaviour in ageing either comes from transplantation experiments25 or mathematical modelling26, which may not recapitulate steady-state haematopoiesis or lacks the resolution of single-cell lineage analysis. In humans, literature focuses on the role of driver mutations in clonal haematopoiesis (CH), but clonal expansions without (known) drivers are common with age and are associated with an increased all-mortality risk27. So far, the lineage output of clones with or without (known) CH driver mutations have not been compared because of a lack of suitable methods.
Here we develop EPI-Clone, a method that exploits the targeted single-cell readout of DNA methylation at single-CpG resolution to track clones while providing detailed cell-state information. EPI-Clone builds on single-cell targeted analysis of the methylome (scTAM-seq), which is implemented on the Mission Bio Tapestri platform to read out methylation states of several hundred CpGs in thousands of single cells at a time, with a dropout rate of around 7%5. scTAM-seq uses a methylation-sensitive restriction enzyme to selectively digest unmethylated CpGs and thus generates sequencing reads only from methylated CpGs. We applied EPI-Clone to lineage-barcoded cells and in native human and mouse haematopoiesis to characterize the decline in clonal complexity and the functional properties of age-expanded clones in mouse and human ageing.
A DNA methylation map of haematopoiesis
We performed a series of experiments, which, for clarity, are defined as follows: scTAM-seq applied to eight different settings in mice (experiments M.1–M.8; Extended Data Fig. 1a); scTAM-seq applied to two human cohorts (A.1–A.7 and B.1–B.5); and experiments demonstrating the combination of scTAM-seq with RNA-seq and mitochondrial lineage tracing from the same cell (X.1 and X.2). An overview of all data is provided in Supplementary Table 1.
To create a ground-truth dataset of clonal identity and DNA methylation, we labelled mouse haematopoietic stem cells (HSCs) with lentiviral barcodes using the LARRY system8. Labelled HSCs were transplanted into lethally irradiated recipient mice and the mice were profiled 5 months later, a time point at which all blood populations should be reconstituted. Sorted haematopoietic stem and progenitor cells (HSPCs) from bone marrow (sorted as LIN−KIT+ (LK) cells with additional enrichment of LIN−SCA1+KIT+ (LSK) cells) were profiled by scTAM-seq (experiment M.1, the main LARRY experiment; Fig. 1a, Extended Data Fig. 1a, Supplementary Table 1 and Supplementary Fig. 1). The experiment was repeated (experiment M.2, replicate LARRY experiment) and we profiled LK and LSK bone marrow from untreated mice (experiment M.3, native haematopoiesis). Specifically, we analysed methylation of 453 CpGs that were selected as differentially or variably methylated from bulk HSPC DNA methylation data22 (Fig. 1b, Methods and Extended Data Fig. 1b,c). The LARRY barcode was read out directly from the DNA by including a LARRY-specific amplicon in our targeting panel for scTAM-seq. Finally, the expression of 20 surface proteins (Supplementary Table 2) was simultaneously profiled using oligonucleotide-tagged antibodies to obtain independent information on cellular differentiation. In summary, for experiments M.1–M.3, we profiled DNA methylation at 453 CpGs and the expression of 20 surface proteins across HSPCs. In experiments M.1 and M.2, we also profiled LARRY barcodes from the same cells.
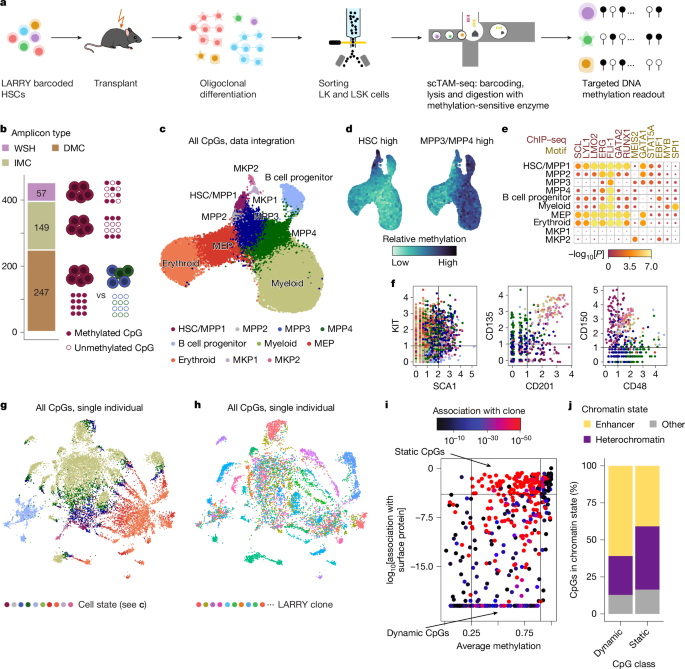
a, Schematic of experiments M.1 (LARRY main experiment) and M.2 (replicate LARRY experiment). b, Overview of the 453 CpGs covered by our scTAM-seq panel in mice. Variably methylated CpGs were selected from bulk whole-genome bisulfite sequencing data22. DMC, differentially methylated CpG; IMC, intermediately methylated CpG; WSH, within-sample heterogeneity (see Extended Data Fig. 1c for definition). c, UMAP of DNA methylation data for HSPCs from experiments M.1–M.3. Batch correction was applied before UMAP. Colours highlight groups identified from unsupervised clustering. Annotations are based on d–f. d, DNA methylation UMAP as in c, highlighting the average, relative methylation state of cells across all CpGs that are methylated in HSCs or MPP3/MPP4 cells in bulk-sequencing data22. e, Enrichment analysis of TFBSs near CpGs specifically unmethylated in a cell-type cluster. See the section ‘Data integration and annotation of cell states’ in the Methods. f, Normalized surface-protein expression of SCA1, KIT, CD135, CD201, CD48 and CD150. The CD135–CD201 and CD48–CD150 plots only show LSK cells. Colour indicates cell states per c. g, UMAP of DNA methylation data from HSPCs from experiment M.1. Colour indicates cell states per c. h, Same UMAP as in g, highlighting clones as defined from LARRY barcodes. LARRY barcodes were read out from DNA as part of scTAM-seq. i, Scatter plot depicting, for n = 453 CpGs, the average methylation rate, the statistical association with surface-protein expression and the statistical association with the LARRY clonal barcode (P value from a two-sided chi-squared test). The CpGs in the upper and lower central rectangle were defined as static or dynamic CpGs, respectively. j, Bar chart depicting the percentage of static and dynamic CpGs annotated as enhancer or heterochromatin. DMC, differentially methylated cytosine; IMC, intermediately methylated cytosine; MEP, megakaryocyte–erythroid progenitor cells; WSH, within-sample heterogeneity. The scTAM-seq schematic in a was adapted from ref. 5 under a Creative Commons licence CC BY 4.0.
We applied Seurat’s default batch-correction method to integrate methylation data from 28,782 cells across the three experiments. We thereby obtained a low-dimensional embedding in which most variation was driven by differentiation along four trajectories (Fig. 1c). To annotate cell states from the DNA methylation data, we used three layers of information: (1) bulk methylation profiles (Fig. 1d and Supplementary Fig. 2a); (2) the methylation states of important lineage-specific transcription-factor-binding sites (TFBSs; Fig. 1e and Supplementary Fig. 2b); and (3) the expression of surface proteins (Fig. 1f and Supplementary Fig. 2c,d). We identified cell-state-specific demethylation of CpGs that neighboured crucial TFBSs, including GATA2 (an erythroid factor), EBF1 (a lymphoid factor) and SPI1 (a myeloid factor) (Fig. 1e and Supplementary Fig. 2b). scTAM-seq data revealed a cluster of HSCs and early multipotent progenitors (MPP1, also called short-term or active HSCs), several additional MPP subsets (MPP2, MPP3 and MPP4), myeloid, erythroid and B cell progenitors, as well as two subsets of megakaryocyte progenitors (MKPs). As we also performed scRNA-seq on different cells obtained from the same samples, we could compare low-dimensional uniform manifold approximation and projection (UMAP) generated by DNA methylation with a UMAP generated from transcriptomic data (Extended Data Fig. 2a). We observed an overall similar topology (Extended Data Fig. 2b) with the four main differentiation trajectories. Overall, through data integration of several experiments, we obtained a DNA-methylation-based map of mouse HSC differentiation at single-CpG resolution. This map contains two orders of magnitude more cells than two previous, single-cell bisulfite sequencing datasets of the haematopoietic system28,29.
DNA methylation encodes clones and cell states
Computational batch-correction methods, by definition, remove most individual-specific signals (Extended Data Fig. 2c). As clonal information is individual-specific, we computed a UMAP display of the data from experiment M.1 only. This analysis revealed that DNA methylation jointly captures two layers of information: differentiation state and clonal identity. Specifically, although cells clustered according to differentiation states (Fig. 1g), they also clustered by their clonal identity as defined through LARRY barcodes (Fig. 1h). To use this clone-specific signal for lineage tracing, we sought to determine whether clonal identity and differentiation affect different subsets of CpGs. We tested for the association of every CpG with the expression of any surface protein and thereby identified differentiation-associated, dynamic CpGs. Performing dimensionality reduction using only these dynamic CpGs (Extended Data Fig. 2d) or only the expression of surface proteins (Extended Data Fig. 2e,f) resulted in a similar landscape to that obtained by batch correction. This finding indicates that dynamic CpGs and surface antigens independently capture differentiation state well. The remaining, static CpGs were frequently associated with clonal identity, as defined through LARRY barcodes (Fig. 1i). Dynamic CpGs were enriched in enhancer elements, whereas the static CpGs were preferentially located in heterochromatic regions (Fisher test P = 2.2 × 10⁻⁵; Fig. 1j). Moreover, static CpGs were enriched in late-replicating domains (Fisher test P = 0.001; Extended Data Fig. 2g). In summary, clonal identity and differentiation state affect the methylation of different sets of CpGs in haematopoietic cells, which creates a valuable tool to read out both processes simultaneously at the single-cell level.
The EPI-Clone algorithm
We focused on exploiting static CpGs to analyse clonal identity. To this end, we developed EPI-Clone, which is divided into three steps: (1) identification of static CpGs, as described above; (2) identification of cells from expanded clones by using cell density in the DNA methylation space defined by the static CpGs; and (3) clustering of cells from the expanded clones (Fig. 2a and Methods).
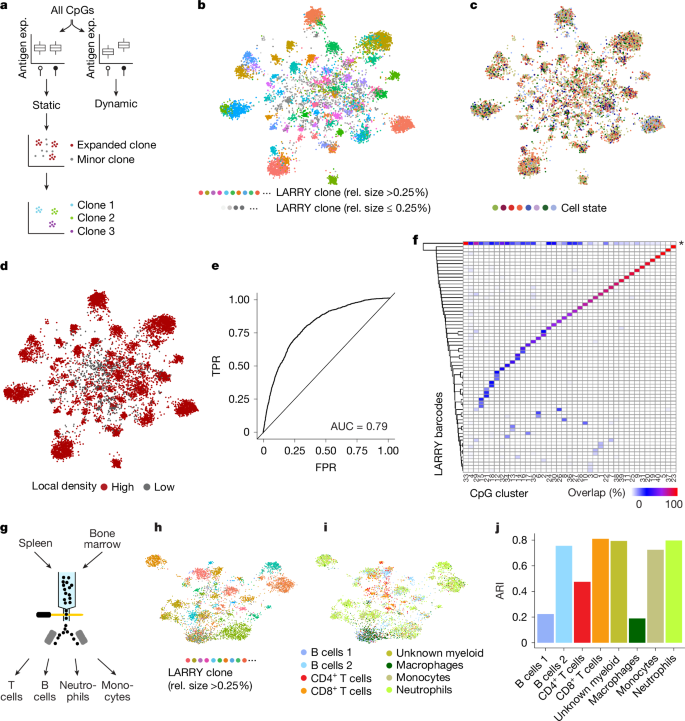
a, Schematic overview of EPI-Clone. See the main text for details. Exp, expression. b, UMAP of DNA methylation computed on static CpGs only for experiment M.1, which highlights clonal identity as defined by LARRY barcodes. Only cells carrying a LARRY barcode are shown and cells with a relative clone size (rel. size; defined using LARRY) less than 0.25% are shown in grey. c, Same UMAP as in b, but highlighting the cell states as defined in Fig. 1c. d, UMAP highlighting cells that were selected as part of expanded clones based on local density in PCA space. e, Receiver-operating characteristics curve visualizing the performance of classifying cells into expanded and non-expanded clones based on local density in PCA space spanned by the static CpGs. LARRY clone size was used as the ground truth, whereby clone sizes larger than 0.25% were considered expanded. TPR, true positive rate; FPR, false positive rate. f, Heatmap depicting the overlap between LARRY barcode and methylation-based clonal clusters identified by EPI-Clone. The row labelled with an asterisk contains all LARRY clones with a clone size less than 0.25%. g, Schematic of experiment M.5: LARRY mature immune cell experiment. h, UMAP of DNA methylation for cells from expanded clones in experiment M.5. Cells are coloured by LARRY barcode. The static CpGs identified from experiment M.1 were used. i, Same UMAP representation as in h, but highlighting the cell-state annotation as defined in Supplementary Fig. 4. Of note, most of the clones identified using EPI-Clone were specific for T cells, B cells or myeloid cells, in line with the result from LARRY (Supplementary Fig. 4d). j, ARI values between the ground-truth clonal label (LARRY) and the clones identified by EPI-Clone stratified by cell type.
Using this algorithm, expanded LARRY clones with relative clone sizes larger than 0.25% clustered separately, with no influence of cell state (Fig. 2b,c and Supplementary Fig. 3). By contrast, cells from small LARRY clones with relative sizes less than 0.25% were interspersed between clusters (Fig. 2d). EPI-Clone identified cells that belong to expanded clones on the basis of the high local density in principal component analysis (PCA) space spanned by the static CpGs (Fig. 2b,d). EPI-Clone correctly identified cells from expanded clones with an area under the receiver operating characteristic curve (AUC) of 0.79 when using the LARRY clone sizes as ground truth (Fig. 2e). Subsequently, EPI-Clone clustered cells from expanded clones by clonal identity, achieving an adjusted rand index (ARI) of 0.88 relative to ground-truth LARRY barcodes (Fig. 2f). Quantitatively and qualitatively similar results were obtained from a biological replicate that used the same parameters and cut-off values in the EPI-Clone analysis (Extended Data Fig. 3; AUC = 0.68, ARI = 0.82). These results demonstrate that epimutational clonal signals are stably maintained in blood stem and progenitor cells over long periods of time (5 months from transplant to analysis).
We next asked whether EPI-Clone can determine clonal identity in mature immune cells. To that end, we collected mature immune (lymphoid and myeloid) cells from bone marrow and spleen (experiment M.5; Fig. 2g, Supplementary Table 1 and Supplementary Fig. 4) and profiled surface-antigen expression and DNA methylation at the same CpGs as in experiments M.1–M.3. Using the static CpGs defined from experiment M.1, EPI-Clone again produced clonal clustering that recapitulated ground-truth clonal labels (Fig. 2h). We separately computed ARI values between EPI-Clone results and LARRY barcodes. ARI values were higher than 0.7 for monocytes, neutrophils, other myeloid cells, CD8+ T cells and one B cell subset, higher than 0.4 for CD4+ T cells and low for macrophages and a second B cell subset (Fig. 2i,j). Most T cells and B cells belonged to lymphoid-dominated (LARRY and EPI-Clone) clones (Fig. 2i and Supplementary Fig. 4d), which implicated an origin in lymphoid-biased or restricted progenitors30. In a separate experiment (M.4), we profiled mature myeloid cells from lung, bone marrow and peripheral blood, and found that myeloid cell types, except macrophages, retained this clonal mark also outside of the bone marrow (Extended Data Fig. 4). These results show that clonal information encoded in the DNA methylation state is maintained in most lineages until terminal differentiation and 10 months after the lentiviral labelling event (Discussion).
Finally, we asked whether EPI-Clone can be applied to tissues other than blood. We used the same CpG panel to sorted endothelial cells (ECs) from lung of an aged mouse. ECs share a common developmental origin with blood (experiment M.6; Extended Data Fig. 5a). Using the dynamic CpGs defined in haematopoiesis and CD31, SCA1 and podoplanin protein-expression information, we identified two previously described types of capillaries and lymphatic ECs31 (Extended Data Fig. 5b–f). Using the same set of static CpGs as in haematopoiesis, EPI-Clone revealed cell-state-independent, yet statistically supported, clusters containing all three cell types (Extended Data Fig. 5g,h). We conclude that a similar set of static and dynamic CpGs defines clones and differentiation states, respectively, in endothelia and haematopoiesis (Extended Data Fig. 5i).
In summary, DNA methylation patterns at static CpGs constitute a broadly applicable clonal barcode.
HSC-expanded clones in mouse ageing
EPI-Clone can provide joint information on the cell state of progenitors, clonal identity and clonally derived progeny. Therefore, it is an ideal method to characterize the clonal dynamics of native (unperturbed) haematopoiesis. In contrast to the transplantation setting, native haematopoiesis has been described as polyclonal32,33, whereby several thousand clones contribute to blood formation. To investigate whether EPI-Clone also identifies clones in native haematopoiesis, we applied it to bone marrow samples from two untreated, young mice (experiment M.7, 12 weeks old; Supplementary Fig. 5a). Approximately 50% of cells were part of large clones (defined as a relative size larger than 1%) that individually made up 1–4% of total HSPCs (Fig. 3a,c). These clone sizes are in line with a study that genetically barcoded adult haematopoietic clones in situ33 (Fig. 3c). The remaining cells were classified as belonging to small and non-expanded clones. A limitation of EPI-Clone is that only cells belonging to expanded clones can be assigned to their clone of origin. Cells belonging to very small clones (<0.25% of cells after transplant and <1% in native haematopoiesis) could be identified as not belonging to expanded clones, but their clonal identity could not be inferred with the cell numbers used here.
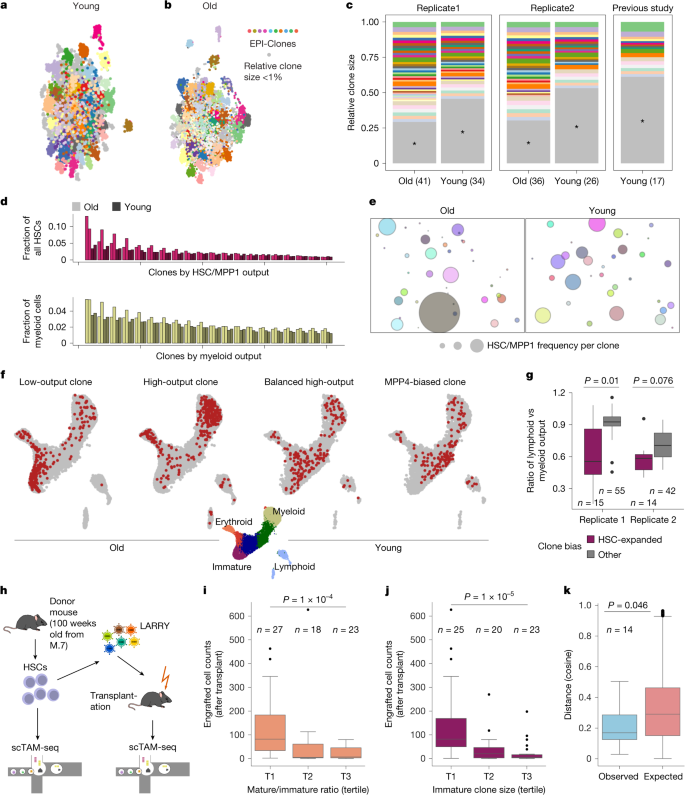
a, DNA methylation UMAP based on the static CpGs for a native, young (12 weeks old) mouse from experiment M.7. b, DNA methylation UMAP based on the static CpGs for an old mouse (100 weeks old). In a and b, three outlier clusters with size <1% were removed to improve visualization. c, Comparison of clone sizes for old and young mice (two biological replicates), and a young mouse from a previous study33. Clones with a relative size less than 1% are shown in grey. d, Comparison of HSC/MPP1 output and myeloid output for the 20 clones with the highest HSC/myeloid output between young and old mice (2 replicates). e, Bubble plot visualizing the frequency of HSC/MPP1 cells per clone for old and young mice. f, Differentiation UMAP defined on the basis of dynamic CpGs, highlighting example clones with different behaviour for old and young mice. For a, b, e and f, data from replicate 1 is shown, see Supplementary Fig. 7 for replicate 2. g, Comparison of the ratio between lymphoid and myeloid output per clone identified using EPI-Clone. P values calculated using two-sided Wilcoxon tests. h, Experimental design for the transplantation experiment (M.8). i,j, Boxplots of post-transplant clone sizes, comparing clones with different pre-transplant differentiation bias calculated as the ratio of mature versus immature cells per clone (i) and different pre-transplant immature clone sizes (j). Tertile T1 has the lowest mature output (i) and smallest clone size (j). k, Boxplot showing the distribution of pairwise cosine observed (Obs.) versus expected (Exp.) distances (before and after transplant) computed using the cell-type distribution of each clone. Observed data are compared with a null model created by randomly shuffling the clonal identities of post-transplant clones (1,000 times). P values of i–k are from two-sided Wilcoxon tests. For d,e,g and i–k, see the section ‘Data visualization’ in the Methods for a definition of boxplot elements and further detail. The scTAM-seq schematic in h was adapted from ref. 5 under a Creative Commons licence CC BY 4.0.
We next applied EPI-Clone to study ageing by comparing the data from young mice (12 weeks old) to 100-week-old mice in two biological replicates (experiment M.7; Fig. 3b and Supplementary Fig. 5a). We observed weak shifts in cell-type proportions between the young and the old mice, a result that confirmed previous observations34 (Supplementary Fig. 5b–e). When comparing the EPI-Clone result, we observed more expanded clones in the old mice than in the young mice (Fig. 3c and Supplementary Figs. 6 and 7). Expanded clones in the old mice were individually also larger than in the young mice (Fig. 3c; two-sided Wilcoxon test P = 0.012). This gradual loss of clonality with age resembles certain properties of human HSC ageing (see below).
Next, we measured the distribution of cell types for each clone across the various stem and progenitor clusters. In the old mice, we observed several expanded clones that contained mostly HSCs across both of our replicates (Fig. 3d–f and Supplementary Fig. 7d,e; Kolmogorov–Smirnov test P < 0.05), which were not present in the young mice. These HSC-expanded clones contained large numbers of stem cells apparently incapable of proceeding with differentiation and contained little progeny. Old mice showed a moderate increase in the number of myeloid-biased clones, which was in contrast to results from classical transplantation experiments35,36,37,38 (Fig. 3d and Supplementary Figs. 6 and 7). However, the rare HSC-expanded clones were mostly myeloid-biased (Fig. 3g; Wilcoxon test P = 0.01 (replicate 1) and P = 0.076 (replicate 2)).
To determine the long-term stability of the HSC-expanded clonal behaviour, we performed a transplantation assay using an aged donor mouse. We used EPI-Clone to compare the clonal composition of the haematopoietic system in the native state (before transplant) and after transplant, and used LARRY barcoding as an additional control during transplantation (experiment M.8; Fig. 3h and Extended Data Fig. 6a). Clonal identities defined using EPI-Clone remained stable during transplantation (Extended Data Fig. 6b–e). HSCs with abundant progeny before transplant showed poor engraftment, a result in line with serial transplantation studies using lentiviral barcoding8,33 (Fig. 3i and Extended Data Fig. 6f). Notably, HSC-expanded clones also engrafted poorly, and we identified non-expanded HSCs as the major drivers of transplantation haematopoiesis (Fig. 3j). Clones with quantifiable output before and after transplant showed a stable lineage bias that was inherited after transplantation (Fig. 3k and Extended Data Fig. 6g).
In summary, our data demonstrate age-related loss of clonal complexity in mouse ageing that is accompanied by an emergence of HSC-expanded clones with low engraftment capacity. We propose that these rare but expanded clones drive the increase in stem cell number and decrease in output that had typically been associated with aged haematopoiesis in transplantation studies39,40,41 and in Cre-lox-based native lineage-tracing studies42. Our transplant data support the idea that HSCs that do not expand with age persist and drive regeneration.
EPI-Clone in human bone marrow
To relate these results to human ageing, we next adapted EPI-Clone for use on human samples. We designed a panel that targeted 448 CpGs with variable methylation between or within blood progenitor populations (Methods and Extended Data Fig. 7a,b). We also included 147 genomic regions commonly mutated in CH and 20 regions that targeted chromosome Y to serve as a partial ground truth for clones identified by EPI-Clone.
We collected CD34+-enriched total bone marrow (TBM) samples from seven donors of different ages (donors A.1–A.7). We also assembled a dataset of CD34+ cells from bone marrow from nine donors (donors B.1–B.5 and X.1, and donors A.1, A.3 and A.4, for whom >1,000 CD34+ cells had been captured from TBM) (Fig. 4a and Supplementary Table 1). Three of the TBM donors had previously been characterized for CH mutations43, and we de novo identified CH mutations or loss of the Y chromosome (LoY) for four additional donors from scTAM-seq data (Methods). In total, we identified ten CH mutations and one LoY event in our cohort. Samples were stained with an antibody panel targeting 45 surface proteins to provide phenotypic characterization. Across all donors, we profiled 135,432 single cells using scTAM-seq.
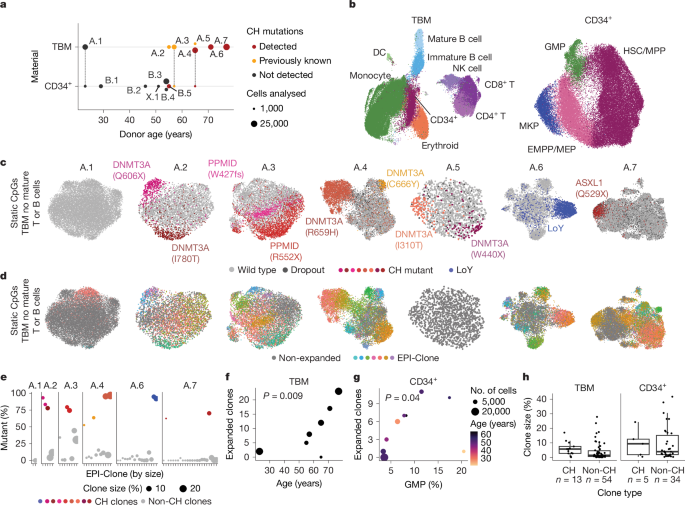
a, Summary of donor characteristics (Supplementary Table 1). Dots connected by dashed lines denote samples that were analysed as part of the TBM and the CD34+ dataset. b, Integrated UMAP of dynamic CpG and surface-protein data for all donors from the TBM and CD34+ datasets. Cell states were annotated based on the expression of surface proteins (Extended Data Fig. 7c–e). c, UMAPs computed per donor on a consensus set of static CpGs, highlighting cells containing the specified CH mutations. See Extended Data Fig. 7f–h and Methods for how consensus static CpGs were identified. The donors are sorted by increasing age. d, UMAPs as in c, highlighting clones identified using EPI-Clone. e, Scatter plot displaying the percentage of cells from each identified clone displaying CH mutations. The identified clones (x axis) are sorted by size. Dots in colours correspond to the clones dominated by a CH mutation, see c for colour scheme. f,g, Scatter plot relating donor age (f) and the presence of GMPs (g) to the number of clones identified by EPI-Clone in the TBM cohort and CD34+ cohort, respectively. P value calculated with a two-sided t-test computed from a generalized linear model of the Poisson family, using the number of cells observed as a weight. Dot size denotes the number of cells analysed (see b for a scale). h, Boxplot depicting clone sizes stratified into clones carrying CH mutations and clones for which no CH mutation was identified. See the section ‘Data visualization’ in the Methods for a definition of boxplot elements.
We followed the same analytical strategy as for the mouse experiments, but with minor adaptations (Methods). Specifically, we detected expanded clones using a statistical criterion (CHOIR44; Extended Data Fig. 3g), and we identified cell types and differentiation states using a combination of both dynamic CpGs and surface proteins (Fig. 4b and Extended Data Fig. 7c–e). We then used all myeloid cells to identify a consensus set of static CpGs across individuals (Extended Data Fig. 7f–h). To assess the fidelity of static CpGs to identify clones, we exploited the CH mutations and LoY events as a clonal ground-truth. CH clones clustered together in static CpG UMAPs in all cases (Fig. 4c and Extended Data Fig. 8a). EPI-Clone recapitulated the CH clones in all donors except A.5, which was covered with substantially fewer cells than the rest of the TBM cohort (Fig. 4d,e and Extended Data Fig. 8b). Quantitatively, the epimutational clones dominated by CH mutant cells were on average 78.8% mutant and those dominated by wild-type cells were on average 95.4% wild-type (Fig. 4e). These numbers probably underestimate the true overlap between the identified clones and CH clones owing to allelic dropout of CH mutations. We observed a stronger separation of clones identified using our algorithm and better overlap with CH mutations in older donors than in young donors. This result suggests that EPI-Clone most accurately identifies clones in haematopoietic systems of reduced clonal complexity. Besides the CH clones, EPI-Clone identified a total of 67 other clonal expansions in the seven TBM donors, a result that highlights the capacity of this algorithm to recapitulate clonal expansions driven by known and unknown drivers.
We included natural killer (NK) cells and immature B cells in our analysis and used CH mutations to validate that these cells also clustered by clone (Extended Data Fig. 8c,d). When T cells and mature B cells were included, they associated with lymphoid-dominant clusters, a finding in line with the results from mice (Fig. 2i and Extended Data Fig. 8e) and indicating their distinct clonal origins compared with the other cells. In donor A.4, in whom a large CH clone contributed to T cells, mutant T cells clustered with the remaining CH-derived cells (Extended Data Fig. 8e). Together with the results from the mouse LARRY experiment, this finding constitutes evidence that the identified clones remain stable from HSCs to myeloid, T cells, NK cells and immature B cells.
To establish a conservative estimate for a minimum clone size of EPI-Clone in humans, we determined the smallest CH clone identified using this method. The clone DNMT3A(C666Y) in donor A.4 had 145 cells or a relative size of 1% in the myeloid compartment. Furthermore, we observed that several large CH clones (for example, DNMT3A(R659H) in donor A.4; Fig. 4d and Supplementary Fig. 8) had diversified into two clones with a similar but distinguishable static CpG profile. This result suggests that over decades, epimutations can continue to accrue phylogenetic information. In conclusion, these analyses demonstrate the ability of EPI-Clone to identify expanded haematopoietic clones of a wide range of sizes in human bone marrow and blood.
Clonal expansions in human ageing
We leveraged the ability of EPI-Clone to trace both CH clones, which are well characterized in humans28,43, and clones without known driver mutations (non-CH clones) to functionally compare these two types of clonal expansions in our TBM and CD34+ cohorts. Owing to their putatively distinct clonal origins, we excluded T cells and mature B cells from this analysis. As expected3, in the TBM cohort, we observed an age-dependent accumulation of expanded CH and non-CH clones (Fig. 4f). Notably, in the CD34+ cohort, which was mostly sampled from individuals aged 50–60 years, we identified a correlation between the fraction of granulocyte–macrophage progenitors (GMPs) in the sample and the accumulation of expanded clones (Fig. 4g), which suggested that cues that enhance myelopoiesis also lead to more clonal expansions.
CH clones tended to be more expanded than non-CH clones, but were not always among the largest ones (Fig. 4h). Expanded clones were significantly depleted (compared with cells from non-expanded clones) from the B cell and erythroid lineages (Fig. 5a,b and Extended Data Fig. 8f), which implicated a link between myelopoiesis and expansion even for non-CH clones. Compared with non-CH clones, CH clones were significantly enriched in HSCs and MPPs but depleted from the B cell and erythroid lineages (Fig. 5b and Extended Data Fig. 8f,g). These results highlight a stem-cell bias in age-expanded clones that is conserved across mice and humans, and they support a model whereby CH clones are part of a spectrum of such age-expanded clones.
https://www.nature.com/articles/s41586-025-09041-8
https://www.lavanguardia.com/ciencia/20250521/10705180/celulas-madre-sangre-abren-mejorar-terapias-antiaging.html