Estudios en ratones realizados por científicos del IRB de Barcelona han demostrado que la vitamina B12 desempeña un papel clave en la reprogramación celular y la regeneración de tejidos
Vitamin B12 is a limiting factor for induced cellular plasticity and tissue repair
Nature Metabolism (2023)
Abstract
Transient reprogramming by the expression of OCT4, SOX2, KLF4 and MYC (OSKM) is a therapeutic strategy for tissue regeneration and rejuvenation, but little is known about its metabolic requirements. Here we show that OSKM reprogramming in mice causes a global depletion of vitamin B12 and molecular hallmarks of methionine starvation. Supplementation with vitamin B12 increases the efficiency of reprogramming both in mice and in cultured cells, the latter indicating a cell-intrinsic effect. We show that the epigenetic mark H3K36me3, which prevents illegitimate initiation of transcription outside promoters (cryptic transcription), is sensitive to vitamin B12 levels, providing evidence for a link between B12 levels, H3K36 methylation, transcriptional fidelity and efficient reprogramming. Vitamin B12 supplementation also accelerates tissue repair in a model of ulcerative colitis. We conclude that vitamin B12, through its key role in one-carbon metabolism and epigenetic dynamics, improves the efficiency of in vivo reprogramming and tissue repair.
Main
Cellular reprogramming consists of the loss of differentiated cell identity followed by the acquisition of embryonic stem pluripotency, which can be achieved by the simultaneous expression of the transcription factors OCT4, SOX2, KLF4 and MYC (OSKM; in mice encoded by Pou5f1, Sox2, Klf4 and Myc, respectively)1. During recent years, it has become evident that this process involves intermediate states in which cells acquire various degrees of plasticity and differentiation potential, which may have broad implications in regenerative medicine and organ repair (reviewed in ref. 2). Continuous expression of OSKM in mice can recapitulate full reprogramming to pluripotency, a process that culminates with the generation of teratomas3. Interestingly, transient expression of OSKM leads to molecular and physiological features of rejuvenation, including an enhanced capacity for tissue regeneration4,5,6,7,8,9. Nevertheless, in vivo reprogramming via OSKM remains a poorly understood process, with low efficiency and high risks, including teratoma and cancer development3,10,11. Thus, we sought to unravel new molecular mechanisms of in vivo reprogramming that could be harnessed to manipulate cell plasticity and tissue repair.
Given the unique metabolic requirements of in vitro reprogramming12,13, we hypothesized that unique metabolic requirements may also operate during in vivo reprogramming. As a new approach, we considered the gut microbiota as a commensal community in metabolic equilibrium with its host. Indeed, the microbiota is sensitive to perturbations in host physiology, capable of adapting and rewiring itself based on nutrient availability and depletion14, a process known as the host–gut microbiota metabolic interaction15. We reasoned that analysis and manipulation of the microbiota could provide new insights into the metabolic requirements of in vivo reprogramming.
In vivo reprogramming is dependent on the microbiota
To study modulators of in vivo reprogramming, we used a previously described mouse model in which doxycycline drives systemic, inducible OSKM expression3,9,16,17. On a short timescale (7 days), OSKM induction causes focal regions of abnormal tissue architecture, correlating with the appearance of rare NANOG-positive cells (a marker of embryonic pluripotency) predominantly in the pancreas, colon and stomach3. We first asked whether the microbiota was important for in vivo reprogramming by disrupting it with a commonly used, broad-spectrum cocktail of antibiotics (ABX): ampicillin, metronidazole, neomycin and vancomycin18. We administered ABX for 3 weeks before and during the 7 days of OSKM induction (Fig. 1a). We noted that mice treated with ABX had very low levels of serum doxycycline (Extended Data Fig. 1a), therefore precluding the induction of OSKM in organs beyond the gastrointestinal tract (Extended Data Fig. 1b). Nevertheless, doxycycline efficiently induced OSKM in the colon and stomach in the presence of ABX (Extended Data Fig. 1b). Strikingly, despite strong transgene induction, reprogramming was significantly reduced in the colon and stomach of ABX-treated mice (Fig. 1b and Extended Data Fig. 1c). Reduction in reprogramming was also reflected in the reduced abundance of SCA1-positive and KRT14-positive cells (Fig. 1b and Extended Data Fig. 1c), markers of early and advanced stages of intermediate in vivo reprogramming, respectively19. Consistent with low levels of reprogramming, ABX-treated mice lost significantly less weight than mice with normal levels of reprogramming (Extended Data Fig. 1d). These results indicate that the microbiota is critical for the successful reprogramming of tissues in vivo.
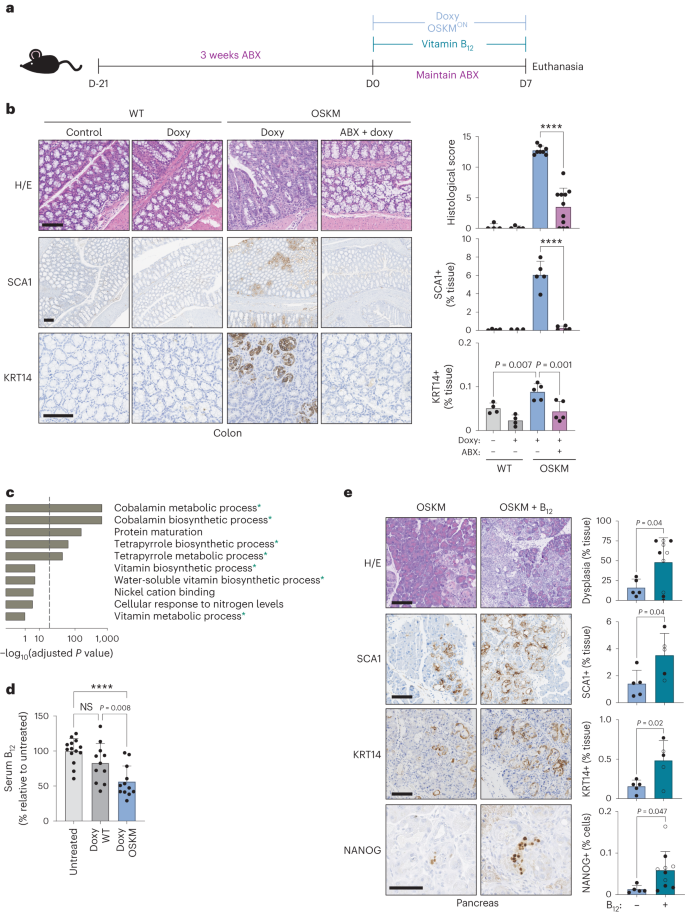
a, Mice were pretreated with an antibiotic cocktail administered in the drinking water for 3 weeks (ABX) before, and during, 7 d of doxycycline administration (doxy), with or without vitamin B12 supplementation according to the schematic. b, Representative histology images and quantification of a blinded histological score, SCA1 staining and KRT14 staining. n = 4 mice (WT; 3 M 1 F), n = 8 (OSKM + doxy; 4 M 4 F), n = 11 (OSKM + doxy + ABX 4 M 7 F); a representative subset of animals was analysed for SCA1 and KRT14. Scale bar, 100 µm. c, GO pathway analysis of differentially abundant microbial gene signatures in the metagenome sequencing of stool samples. Changes in microbial gene abundance between day 7 and day 0 were compared in a subset of WT (n = 4; 2 M 2 F) and OSKM (n = 4; 2 M 2 F) mice from b. See Supplementary Table 1 for complete gene list. The overlap between GO terms and the 200 most differentially depleted or enriched genes was scored using standard hypergeometric tests and GO terms above a threshold of 30% FDR are shown (for all GO terms, see Supplementary Table 2). Processes marked with an asterisk are directly related to cobalamin metabolism. Dashed line indicates 5% FDR cut-off. d, Serum holoTC (biologically available vitamin B12) levels as measured by ADVIA immunoassay in untreated mice or WT and OSKM mice treated with doxycycline for 7 d. n = 14 mice (untreated; 6 M 8 F), n = 11 (doxy WT doxy; 7 M 4 F), n = 12 (doxy OSKM doxy; 6 M 6 F). e, OSKM mice received vitamin B12 supplementation co-administered with doxycycline as indicated and representative images and quantification are shown for the indicated markers in the pancreas. Mice marked by an open circle received both B12 and folate (B9) supplementation (not significant (NS) difference for B12 versus B12 + folate; see text for details). n = 5 mice (OSKM; 2 M 3 F), n = 10 mice (OSKM + B12; 4 M 6 F); a representative subset of n = 5 animals per group was analysed for SCA1 and KRT14. Scale bars, 100 µm. Bar graphs represent the average ± s.d.; ****P < 0.0001 by two-tailed Student’s t-test.
In vivo reprogramming causes microbial dysbiosis
Given the profound impact that disruption of the microbiota had on in vivo reprogramming, we reasoned that a functional analysis of microbial changes during this process could illuminate previously unknown requirements for reprogramming. To this end, we isolated bacterial DNA from paired stool samples of both OSKM-expressing mice and wild-type (WT) littermate control mice before and after 7 days of doxycycline treatment, and performed shotgun metagenome sequencing20 (Extended Data Fig. 2a–c and Supplementary Tables 1 and 2). In both WT and OSKM mice, the microbial diversity as measured by the Shannon index decreased following 7 days of doxycycline treatment, with the most profound loss of diversity occurring in reprogrammed mice (Extended Data Fig. 2a). At a genus level, reprogrammed mice were characterized by a relative expansion of Chlamydia, Bacteriodes and Alistipes spp. and a relative contraction of Muribaculaceae spp. (Extended Data Fig. 2b). Muribaculaceae have been reported to contract during inflammatory colonic injury21, which shares features with in vivo reprogramming including inflammation and loss of differentiated cell identity22. Alistipes on the other hand, have been reported to promote colonic interleukin (IL)-6 production23, which is an important mediator of in vivo reprogramming16.
In vivo reprogramming reduces systemic vitamin B12 levels
Our whole-genome approach allowed us to investigate changes not only in bacterial species abundance, but also in gene composition and ontology groups, which could uncover pathways relevant to reprogramming. Remarkably, we found that microbial gene modules related to the biosynthesis and metabolism of cobalamin (vitamin B12) dominated the bacterial Gene Ontology (GO) groups altered during reprogramming (Fig. 1c and Supplementary Table 2). Under conditions of disrupted cobalamin bioavailability, competition for vitamins can shift the relative abundance of cobalamin-producing and cobalamin-utilizing bacteria in a process referred to as ‘corrinoid remodelling’14,24. We found microbial changes consistent with this phenomenon in reprogramming: the few genera of bacteria able to synthesize B12 (~20 genera)25 were generally enriched in OSKM mice after 7 days of doxycycline, with Proteus, Escherichia and Salmonella being most significantly enriched among the B12 synthesizers (Extended Data Fig. 2c and Supplementary Table 2).
The observed changes in the gut microbiota could be indicative of a systemic deficit in B12, affecting not only the microbiota but also the entire physiology of the host. To test this, we examined systemic vitamin B12 levels in the serum during reprogramming, which were significantly reduced in OSKM mice after 7 days of doxycycline administration (Fig. 1d). The liver is one of the organs with the greatest demand for vitamin B12 (ref. 26) and, as such, is sensitive to B12 deficiency27. In rodents, this manifests as depletion of phosphatidylcholines (PCs)28, which are produced in large quantities by the liver in a B12-dependent manner. We saw that PCs were significantly reduced in the serum of reprogrammed mice as compared to WT mice treated with doxycycline (Extended Data Fig. 3a). Importantly, the liver of OSKM mice does not exhibit histological changes after 7 days of doxycycline9, making the reduction in PCs unlikely to reflect liver dysfunction as a result of reprogramming. The kidney is another organ that is refractory to reprogramming in our mouse model3; however, we did observe a significant depletion of vitamin B12 from the proximal tubules during reprogramming (Extended Data Fig. 3b). The kidney is the primary site of B12 concentration and storage in rodents, from where it is released for use by other organs upon systemic deficiency27,29,30,31. Collectively, these results suggest that vitamin B12 becomes systemically depleted during in vivo reprogramming, affecting both the colonic microbiota and the host.
Vitamin B12 supplementation improves in vivo reprogramming
Given the systemic reduction of vitamin B12 during in vivo reprogramming, we hypothesized that B12 supplementation could enhance reprogramming under normal conditions (that is, in the absence of ABX). Indeed, vitamin B12 supplementation significantly improved in vivo reprogramming in the pancreas, colon and stomach, as evaluated by the extent of histological dysplasia and SCA1 or KRT14 levels (Fig. 1e and Extended Data Fig. 3c–e). B12 also increased the number of NANOG+ cells, a marker of full pluripotency, in the pancreas (Fig. 1e and Extended Data Fig. 3f). B12 administration did not affect transgene expression (Extended Data Fig. 3g). Even after B12 supplementation, we could not detect histological evidence of reprogramming in the kidney (Extended Data Fig. 3h). However, we did observe a significant increase of vitamin B12 stores within the kidney after supplementation (Extended Data Fig. 3b), indicating that B12 absorption, distribution and storage were occurring normally in the reprogrammed mice.
We also wondered if B12 supplementation could rescue the reprogramming defect of ABX-treated mice. Interestingly, B12 supplementation was able to partially rescue reprogramming in the colon (Extended Data Fig. 3c–e). This supports the concept that an important role of the microbiota during murine reprogramming is to increase the dietary supply of B12 through coprophagy. Another B vitamin that is partly supplied by the microbiota in rodents and humans is vitamin B9 (folate)32, which is functionally related to B12 (ref. 33). However, co-supplementation of B12 and B9 was indistinguishable from B12 alone (Fig. 1e and Extended Data Fig. 3c,f,g). Collectively, these results demonstrate that vitamin B12 is a limiting factor for in vivo reprogramming.
One-carbon metabolism drives vitamin B12 demand during reprogramming
In both humans and mice, vitamin B12 is used as a cofactor by only two enzymes: methionine synthase (MS) and methylmalonyl-CoA mutase (MUT)26. MS uses B12 as a cofactor to regenerate methionine (Met) from homocysteine (Hcy), forming an integral part of one-carbon (1C) metabolism (Fig. 2a). Met is used to synthesize S-adenosylmethionine (SAM), the universal methyl donor for all methylation reactions33. The nuclear-encoded mitochondrial enzyme MUT uses B12 as a cofactor for the catabolism of branched-chain amino acids via isomerization of methylmalonyl-CoA to succinyl-CoA, for use in the tricarboxylic acid cycle (Extended Data Fig. 4a)26.
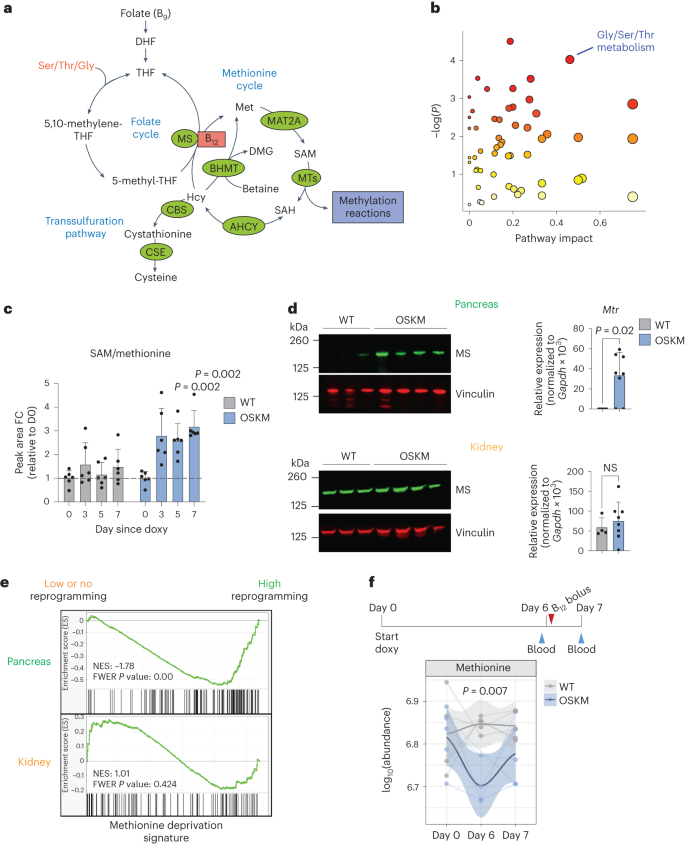
a, Summary of the mammalian folate and methionine cycles (1C metabolism) and the transsulfuration pathway. Enzymes are marked in green. Coenzyme vitamin B12 is marked in red. DHF, dihydrofolate; THF, tetrahydrofolate; MTs, methyltransferases; ACHY, adenosylhomocysteinase; CSE, cystathionine gamma-lyase; DMG, dimethylglycine; Ser, serine; Thr, threonine; Gly, glycine. Figure adapted from ref. 33, Springer Nature Limited. b, Changes in metabolic pathways during reprogramming. MetaboAnalyst (4.0)91 was used to assess the annotated metabolites identified in the serum of paired OSKM mice (n = 6; 3 M 3 F) at day 5 versus day 0 of doxycycline treatment (serum was collected repeatedly from the same mice). Colour gradient from white to red indicates the P value; red is most significant. Gly/Ser/Thr metabolism (KEGG map00260) is highlighted. See Supplementary Table 3 for all metabolites, pathways and scores. c, Fold change (FC) of SAM/Met ratio detected by mass spectrometry from b on the indicated days. P values represent significant difference between OSKM and WT mice. d, Levels of MS (encoded by Mtr) by immunoblot and RT–qPCR in the pancreas (upper) and kidney (lower) from WT (n = 4; 3 M 1 F) and OSKM (n = 8; 4 M 4 F) mice treated with doxycycline for 7 d. Representative mice are shown in the immunoblot. e, Previously published RNA-seq data16 from the pancreas (highly prone to reprogramming; green) and kidney (refractory to reprogramming; orange) of OSKM-Cdk2na−/−(low or absent reprogramming) and OSKM-Tp53−/− (high reprogramming) mice were used to perform GSEA against a published signature (MsigDB: M13537) of Met deprivation39. f, WT and OSKM mice (n = 5 per group; 5 M) were treated with doxycycline and a bolus of vitamin B12 as shown in the schematic. Met levels were measured in the indicated serum samples by mass spectrometry. Only n = 4 WT (day 0) and OSKM (day 6) mice are represented, as the blood volume was insufficient. Welch’s two-sample t-test was used to evaluate differences between groups on day 6. Bar graphs represent the average ± s.d.; P values determined by a two-tailed Student’s t-test.
As a first approach to investigate B12-dependent metabolism during in vivo reprogramming, we performed untargeted serum metabolomics. The metabolic pathway with the strongest (by pathway impact) and most significant changes during reprogramming was ‘glycine (Gly), serine (Ser), threonine (Thr) metabolism’ (Kyoto Encyclopedia of Genes and Genomes (KEGG) pathway map00260; Fig. 2b and Supplementary Table 3). These three amino acids, together with Met, feed 1C metabolism (Fig. 2a). Notably, Thr is known to be critical for the generation of SAM during in vitro reprogramming and in the maintenance of pluripotent cells12,34,35. In OSKM as compared to WT mice, we saw significant depletion of all four of these amino acids (Gly, Ser, Thr and Met), concomitant with an increase in SAM and an increase in the SAM/Met ratio, progressively over the course of reprogramming (Fig. 2c and Extended Data Fig. 4). The increased SAM/Met ratio was indicative of methylation cycle activation, which occurs during in vitro reprogramming13 and in cultured pluripotent cells12,34,35. Neither Hcy nor S-adenosyl-l-homocysteine (SAH), two important 1C metabolites, were detected via untargeted metabolomics, so we performed a separate, targeted serum metabolomic analysis. We found that the SAM/SAH ratio, known as the ‘methylation index’ because it indicates the methylation capacity of an organism36, was significantly increased during in vivo reprogramming (Extended Data Fig. 4c). We did not observe changes in Hcy (Extended Data Fig. 4c). Although Hcy accumulation can occur clinically as a result of B12 insufficiency in humans26, we observed that induced pluripotent stem (iPS) cells upregulate the expression of genes encoding two main consumers of Hcy: cystathionine beta-synthase (CBS, which initiates the transsulfuration pathway) and betaine-homocysteine methyltransferase (BHMT, which synthesizes Met using Hcy and betaine in an MS-independent manner; Fig. 2a and Extended Data Fig. 4d). In support of this, we found that serum betaine levels were significantly decreased during in vivo reprogramming (Extended Data Fig. 4e), which may serve as an additional or alternate source of Met generation.
On the other hand, methylmalonic acid (MMA), the substrate of MUT, showed no significant differences between OSKM mice and WT littermate controls treated with doxycycline (Extended Data Fig. 4b). The MMA levels, along with decreases in Mmut expression in several organs (Extended Data Fig. 4f), suggested that MUT’s enzymatic activity does not become limiting during reprogramming. It is important to note that while serum accumulation of MMA and Hcy are sensitive biomarkers of vitamin B12 deficiency in humans26, this is not the case in mice37,38.
We next asked whether the metabolic alterations related to 1C metabolism in the serum were caused by changes specifically within those tissues undergoing reprogramming. We first examined expression of MS, which was upregulated at both the protein and RNA levels in the pancreas, colon and stomach of mice undergoing reprogramming, but not in the kidney (Fig. 2d and Extended Data Fig. 5a). Expression of Cd320, the main receptor for cellular uptake of B12 (ref. 26), was significantly upregulated in the reprogramming pancreas (Extended Data Fig. 5b). We also examined a gene signature of Met deprivation39 by gene-set enrichment analysis (GSEA). As a proof of concept, we tested this signature in previously published bulk RNA-sequencing (RNA-seq) data from in vitro OSKM reprogramming40, and found it was significantly enriched in iPS cells as compared to the mouse embryonic fibroblasts (MEFs) from which the iPS cells were derived (Extended Data Fig. 5c). This is consistent with the fact that ESCs require high Met levels for self-renewal and survival34. We then tested this Met deprivation signature in previously published bulk RNA-seq data from in vivo reprogramming16. At day 7 of doxycycline treatment, Met deprivation was significantly enriched in the pancreas of mice with high levels of reprogramming as compared to mice genetically resistant to reprogramming; in contrast, there was no enrichment of this pathway in the kidney (Fig. 2e). To further validate these results, we analysed a subset of genes from the Met deprivation signature, which were among the most highly enriched by GSEA, in reprogramming tissues by quantitative PCR with reverse transcription (RT–qPCR). A total of 11 genes were assessed and, interestingly, they were broadly upregulated in the pancreas, colon and stomach—but not in the kidney—of mice expressing OSKM (Extended Data Fig. 5d). A subset of these genes was basally high in the colon due to their importance in the stem cell compartment. Importantly, B12 supplementation generally relieved the upregulation of these genes, in support of the idea that limiting B12 levels were driving the Met restriction in vivo. In the kidney, these genes were induced with B12 supplementation, likely a feedback response caused by the large influx of B12 storage into the kidney after supplementation (Extended Data Fig. 3b).
Finally, to ensure that the depletion of serum B12 levels and its associated low levels of Met were not simply caused by defective oral uptake due to the reprogramming of several digestive organs, we administered a large bolus of vitamin B12 (5 µg per mouse, 100 times the recommended dietary allowance41) on day 6 of doxycycline treatment, 1 day before euthanasia (Fig. 2f). Mice expressing OSKM had significantly higher levels of serum B12 than WT mice following the bolus (Extended Data Fig. 5e,f), which is known to occur in B12-deficient rodents27,31, and further indicated that reprogramming does not compromise oral bioavailability of B12. Strikingly, the bolus rescued the depletion of Met levels in the serum (Fig. 2f).
Together, these data suggest that tissues undergoing reprogramming are the ones driving the depletion of serum factors that feed 1C metabolism, including Met, serine, glycine, threonine, betaine and vitamin B12. B12 becomes a limiting factor, as shown by the effects of B12 supplementation in rescuing Met deprivation and promoting reprogramming.
Vitamin B12 plays a cell-autonomous role in reprogramming
In vivo, vitamin B12 deficiency yields a complex phenotype because it impacts multiple cellular processes and organ functions26. Therefore, we asked whether the effect of B12 on reprogramming could be recapitulated in vitro. We first observed, in a previously published bulk RNA-seq dataset of MEFs undergoing in vitro reprogramming40, that Mtr and Cd320 were upregulated soon after OSKM induction, remaining high during the early and middle phases of reprogramming, ultimately stabilizing to levels above those measured in MEFs (Extended Data Fig. 6a). This suggests that during in vitro reprogramming there is also a high demand of B12 and Met, which we explored further using pharmacological manipulation of the Met cycle. The addition of B12 significantly increased the efficiency of iPS cell colony formation (Fig. 3a), recapitulating our observations in vivo and demonstrating a cell-intrinsic role for vitamin B12 in reprogramming. Of note, B12 supplementation increased the number of successfully formed iPS cell colonies without an obvious effect on the rate of colony formation (Extended Data Fig. 6b), and the improved efficiency was also observed in a doxycycline-free, retroviral-based reprogramming system in WT MEFs (Extended Data Fig. 6c). The B12-mediated increase in reprogramming efficiency was prevented by concomitant treatment with a methionine adenosyltransferase 2A inhibitor (MAT2Ai; Fig. 3a); MAT2A is the enzyme immediately downstream of MS, which converts Met into SAM (Fig. 2a). Moreover, directly supplementing only SAM at a high concentration34 during reprogramming significantly improved the efficiency of the process, even beyond that of B12 itself (Fig. 3a).
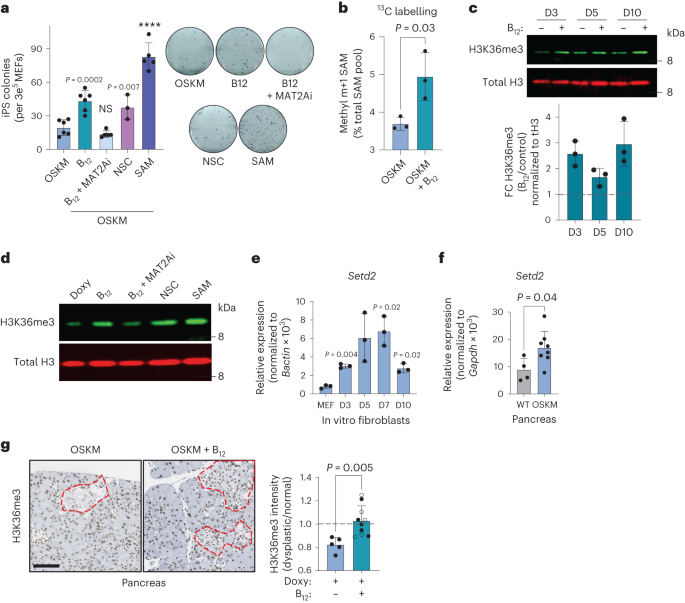
a, In vitro reprogramming of MEFs with doxycycline-inducible OSKM for 10 d in the presence of doxycycline (OSKM) and/or vitamin B12, MAT2Ai, KDM4A/KDM4B inhibition (NSC), or SAM as indicated, cultured in KSR. iPS cell colonies were quantified by alkaline phosphatase staining (left) and representative images are shown (right). Each data point represents MEFs generated from an independent embryo (n = 6 OSKM, B12; n = 5 B12 + MAT2Ai, SAM; n = 3 NSC). b, Fraction of total intracellular SAM 13C-labelled at the methyl m + 1 position (Extended Data Fig. 6d), using 13C-serine as a precursor. Labelling was initiated at t = 72 h for 6 h. Data from n = 3 independent MEFs are shown. c, H3K36me3 dynamics during in vitro reprogramming. MEFs were treated with doxycycline with or without vitamin B12 as indicated. A representative immunoblot and quantification from n = 3 independent MEFs are shown. d, H3K36me3 level correlates with reprogramming efficiency in vitro. MEFs were treated as indicated and H3K36me3 levels were probed in histone extracts at day 3 after doxycycline treatment. A representative blot from n = 2 independent MEFs with similar results is shown. e,f, Expression of the H3K36 trimethyl-transferase Setd2 during in vitro (e) and in vivo pancreatic (f) reprogramming. In e, P values represent significant change from the parental MEFs (n = 3 MEFs). In f, samples were collected from WT (n = 4; 3 M 1 F) or OSKM (n = 8; 4 M 4 F) mice after 7 d of doxycycline treatment. g, H3K36me3 during in vivo reprogramming. Pancreatic tissue from OSKM mice treated with doxy (n = 5; 2 M 3 F) or doxy + B12 (n = 10; 4 M 6 F; Fig. 1) was stained for H3K36me3. Representative images are shown with dysplastic foci demarcated by red dashed lines. The mean nuclear optical density of the H3K36me3 stain is expressed as the ratio between the dysplastic region and the adjacent normal tissue for each mouse. Scale bar, 100 µm. Mice that received folate in addition to B12 are represented by open points. Graphs represent the average ± s.d.; ****P < 0.0001 by two-tailed Student’s t-test.
To directly assess the contribution of B12 supplementation to SAM generation, we performed stable isotope labelling (SIL) with 13C-labelled serine. Serine significantly decreases in the serum during in vivo reprogramming (Extended Data Fig. 4b) and can contribute as a methyl donor to 1C metabolism (Extended Data Fig. 6d). We began SIL 72 h after OSKM induction, well before iPS cell colonies are formed. Culturing cells with 13C-serine did not affect the reprogramming efficiency, nor the capacity of B12 to enhance reprogramming (Extended Data Fig. 6e). Importantly, B12 significantly stimulated the incorporation of the 13C-methyl donor group (m + 1) from serine into SAM (Fig. 3b). Collectively, these data demonstrate that B12 operates in a cell-intrinsic manner during in vitro reprogramming and that it is a limiting factor for SAM generation and successful reprogramming in vitro.
H3K36me3 is enhanced by vitamin B12 during reprogramming
sigue en
https://www.nature.com/articles/s42255-023-00916-6
Bioinformatic analysis
RNA-seq data processing
All analyses were performed in the R programming language (version 4.0.5)96 unless otherwise stated. Stranded paired-end reads were aligned to the Mus musculus reference genome version mm10 using STAR80 with default parameters. STAR indexes were built using the ENSEMBL annotation version GRC138.97. SAM files were converted to BAM and sorted using sambamba (version 0.6.7)97. Gene counts were obtained with the featureCounts function from the Rsubread package98 with the gtf file corresponding to ENSEMBL version GRC138.97 and parameters set to: isPairedEnd = TRUE and strandSpecific = 2. Technical replicates were collapsed by adding the corresponding columns in the count matrix.
Reprogramming score
We obtained a reprogramming gene signature from published data48 and selected genes with false discovery rate (FDR) lower than 0.05 and fold change between MEF and d3-EFF larger than 2. The reprogramming score was defined as the average of all genes in the signature after scaling the rlog transformed matrix.
Computation of cryptic transcript ratios between first and intermediate exons
Exon counts were generated using the featureCounts function with parameters: isPairedEnd = TRUE, strandSpecific = 2, GTF.featureType = exon, GTF.attrType = transcript_id, GTF.attrType.extra = gene_id, allowMultiOverlap = TRUE and useMetaFeatures = FALSE and the same GTF as for gene counts. Technical replicates were collapsed by adding the corresponding counts. For each gene, the longest annotated transcript was selected. Genes with less than four exons of RPKMs lower than exp(−2) were discarded from the analysis. Intermediate exons were defined as those from the fourth to the penultimate. A total of 9,365 genes were used to compute the ratio between the intermediate and first exons. Fold changes between untreated and B12-treated samples were computed as the ratio between the exon ratios.
Comparison of cryptic transcript ratios between conditions
Genes were separated by their expression after transcript length and library size normalization (RPKM). For each sample, we computed the median ratios for genes in each decile.
Analysis of CT in DSS time course
Data were accessed from GSE131032. Reads were processed and ratios computed as previously described. log2 ratios for all transcripts were summarized through the median by sample. Comparisons between days were performed fitting a linear model to the medians using ‘cage’ as a covariable. The function glht from the multcomp R package was used to find coefficients and P values.
Functional enrichment in genes with exon ratios affected by vitamin B12 treatment
To select genes most affected by the B12 treatment after reprogramming, we compared ratios between the doxy and MEF conditions and between the doxy and doxy + B12 conditions. Genes that increased the ratios in the first comparison (upper 25th percentile) and decreased the ratio in the second comparison (bottom 25%) were selected for functional enrichment analysis. A hypergeometric test was performed to find significant overlap between the defined gene set and the Biological Processes GO collection99.
ChIP–seq data processing
Reads were aligned to the mm10 reference genome with bowtie100 version 0.12.9 with parameters --n 2 and --m 1 to keep reads with multiple alignments in one position. SAM files were converted to BAM and sorted using sambamba version 0.6.7.
Heat maps of average coverage in gene bodies
For each sample, aligned reads were imported into R using the function scanBam from the Rsamtools package101. Whole-genome coverage was computed using the coverage function from the IRanges package102 and binned into 50-bp windows. Gene annotations were imported from Ensembl version GRCm38. The average coverage over gene bodies was computed using the normalizeToMatrix function from the EnrichedHeatmap package103 with parameters extend = 1,000, mean_mode = w0 and w = 50. Genes were filtered to coincide with those used in the exon ratio calculation from the RNA-seq data. Rows in the heat map were split by the average RNA-seq RPKM values in all samples.
Visualization of ChIP tracks
BAM files were transformed to TDF files using the count function from IGVtools (version 2.12.2)104 with parameters --z 7, --w 25 and --e 250. Visualization of TDF files was generated using IGV (version 2.9.4)105.
Analysis of human RNA-seq data
Data were accessed from GSE109142. Reads were processed and ratios computed as previously described except using the ENSEMBL GRCm38.101 human gene annotation and the hg38 genome assembly version. The log2 ratios for all transcripts were summarized through the median by sample. Comparison between diagnosis status was performed fitting a linear model to the medians with sex and the expression quantiles as covariables. The model was fitted using the lm R function and coefficients and P values with the coeff function.
Statistics and data availability
Statistical analysis and figure preparation
Unless otherwise specified, data are presented as the mean ± s.d. Statistical analysis was performed by Student’s t-test or one-way analysis of variance (ANOVA) as indicated, using GraphPad Prism v9.0.0, and specific statistical tests as indicated for each experiment for bioinformatic analyses. P values of less than 0.05 were considered as statistically significant. No statistical methods were used to predetermine sample size in the mouse studies, but our sample sizes are similar to those reported in previous publications3,9,16,17,19. Animals and data points were not excluded from analysis with the exception of the MEFs that failed to reprogram in the ChIP experiment, which is clearly detailed in the text. Mice were allocated at random to treatment groups, with attempts to balance initial body weight and sex as possible. The investigators were blinded during histological assessment of the mice; other data collection and analysis was not performed blind to the conditions of the experiments. Data distribution was assumed to be normal, but this was not formally tested. Figures were prepared using Illustrator CC 2019 (Adobe).
Reporting summary
Further information on research design is available in the Nature Portfolio Reporting Summary linked to this article.
Data availability
All sequencing data are deposited under the following Gene Expression Omnibus accessions: GSE154149, microbial genome analysis from OSKM and WT mice pretreatment and after 7 d of 1 mg ml−1 treatment with doxycycline in the drinking water; GSE200578, ChIP–seq of H3k36me3 samples of OSKM reprogramming MEFs treated with B12; GSE200579, RNA-seq samples of OSKM reprogrammable MEFs treated with or without vitamin B12; GSE232382, RNA-seq samples of OSKM reprogrammable MEFs treated with vitamin B12 and/or various compounds to modulate SAM or histone methylation. Previously published datasets that were used for analysis in the current study are: GSE131032, RNA-seq of time-course analysis of repairing murine epithelium after DSS injury; GSE109142, RNA-seq of human paediatric ulcerative colitis and normal tissue controls; GSE102518, RNA-seq of murine in vitro reprogramming in MEFs of varying genotypes; GSE77722, RNA-seq of murine in vivo reprogramming in mice of varying genotypes. Source data are provided with this paper.
https://www.nature.com/articles/s42255-023-00916-6
Contributions
M.K. designed and performed most experiments, contributed to bioinformatic data analysis, performed quantification of immunohistochemistry and co-wrote the paper. E.M., D.C., F.P., R.B., A.H.-H. and M.R. provided general experimental support. A.C. and C.S.-O.A. designed and performed bacterial bioinformatic analysis. C.S.-O.A. designed and performed RNA-seq and ChIP–seq bioinformatics analysis. A.J., J.C., S.D., O.Y., E.M. and G.K. performed metabolomics experiments. E.M., D.C., F.P., A.J., S.D., O.Y. and G.K. helped design and analyse metabolomics experiments. N.P. performed the histopathological study and supervised the histopathological techniques. M.S. designed and supervised the study, secured funding, analysed the data and co-wrote the paper. All authors discussed the results and commented on the paper.
No hay comentarios:
Publicar un comentario